


Vypr and data quality: Representativeness

Welcome to the second article in our series on all things data quality at Vypr. Our previous article covered Methodology. In this second article of our data quality series at Vypr, we delve into the importance of Representativeness. This critical component is essential to ensure the highest sample and data quality standards, providing reliable and trusted consumer intelligence.
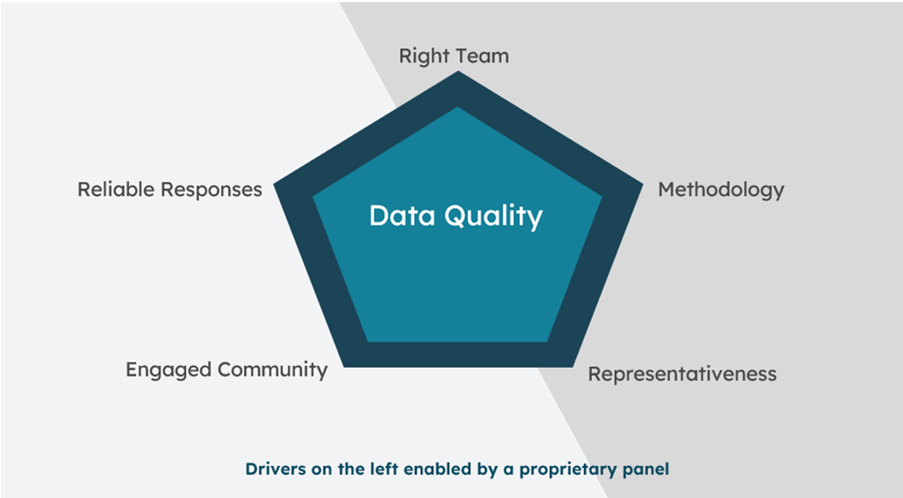
At Vypr, our panel is proprietary. This means we are fully accountable for recruiting and managing our community sample, including selecting the best consumer sources for the highest quality.
Our sample design has two core objectives. Firstly to control the correct balance of key geo-demographics, age, gender and region in order for our members to be representative of the 18+ age population. Secondly, to ensure we have healthy consumer volumes in each target so steers close quickly and accurately.
We also keep an eye on important secondary targets such as income, social class, and dietary preferences. We ensure these are as balanced as possible.
All samples suffer from churn and therefore need to be carefully managed to minimise the turnover and replace consumers that do leave. At Vypr we actively manage the panel on a day to day basis, replacing those that choose to leave voluntarily and those who we choose to ban if the quality of their responses falls below our standards.
We use ‘top-up’ recruitment to replace sample churn in specific geo-demographic groups and select recruitment partners offering the best quality respondents.
We continuously manage and maintain the sample balance using a combination of targeted paid recruitment with specialist partners, social media (Facebook, Instagram, and TikTok),and referrals. Vypr has a number of key metrics to measure performance and make adjustments as needed.
For example, we use a statistical KPI called ‘Quality of Fit’ (QoF) to measure the representation of our active community sample vs the latest key population profile targets. As a customer, you want to know that the insights and data you receive from a company are reliable and representative of the larger population.
At Vypr, we understand this need and have developed a unique approach to ensure the accuracy of our community sample. Our statistical KPI, Quality of Fit (QoF), focuses exclusively on our “active community.” These are the members who have answered at least one steer in the last week, rather than the 70k plus that we have recruited over time. We can provide accurate and meaningful insights by measuring the representation of our most engaged members.
In addition, we update our population targets annually based on the latest available data from the Office of National Statistics (ONS). This ensures that our QoF results are always fresh, relevant, and reliable. You can have confidence and trust in the representativeness of our community sample, knowing that the insights you receive from Vypr are of the highest quality.
Please find our QoF formula with an explanation as detailed below
Formula for Quality of Fit:
For each characteristic (for example, Age, Gender or Region):
Ai = Actual value sub-set i (for example, 18-24 years)
Ti = Target value sub-set i (for example 10.3% for 18-24 years)
All sums should be done for i=1 to n, where n is the number of sub-sets (for example 6 standard age breaks)
QoF:
1 – ∑( |(Ai/Ti -1)| x Ti/∑Ti)
What is the formula doing?
1 – ∑( |(Ai/Ti -1)| x Ti/∑Ti)
Measuring the variation from the target population value
1 – ∑( |(Ai/Ti -1)| x Ti/∑Ti)
Takes the absolute value of the variation. The +/- sign (under-sample or over sample) is not important, just the size of the variation.
1 – ∑( |(Ai/Ti -1)| x Ti/∑Ti)
Factors in the significance of sub-set i (% of the total for the characteristic). So for example the 18-24 age group is 10.3% of the 18+ UK population vs 16.4% for the 55-64 age group.
1 – ∑( |(Ai/Ti -1)| x Ti/∑Ti)
Sums this up for all sub-sets (i=1 to n) in the characteristic
QoFs for each marginal characteristic (age, gender, region) can be averaged for the samplerepresentativeness to get an overall QoF.
In conclusion, our approach to representativeness ensures that our customer insights are reliable and trusted. Next month, we will look at Engaged Community, but in the meantime, if you do have any questions please get in touch with us and we will be more than happy to help.